
Sub System Reconciliation
Sub System Reconciliation
Track and verify that every inter-entity transfer is accounted for on both sides — automatically.
Overview
Sub System Reconciliation gives you real-time visibility into how well your transfers reconcile between two entities. Whether you're operating across multiple subsidiaries, custodians, or on-chain wallets, this feature continuously monitors your sub-transactions and highlights anything that hasn't been matched yet.
You'll find it under Overview > Reconciliation.
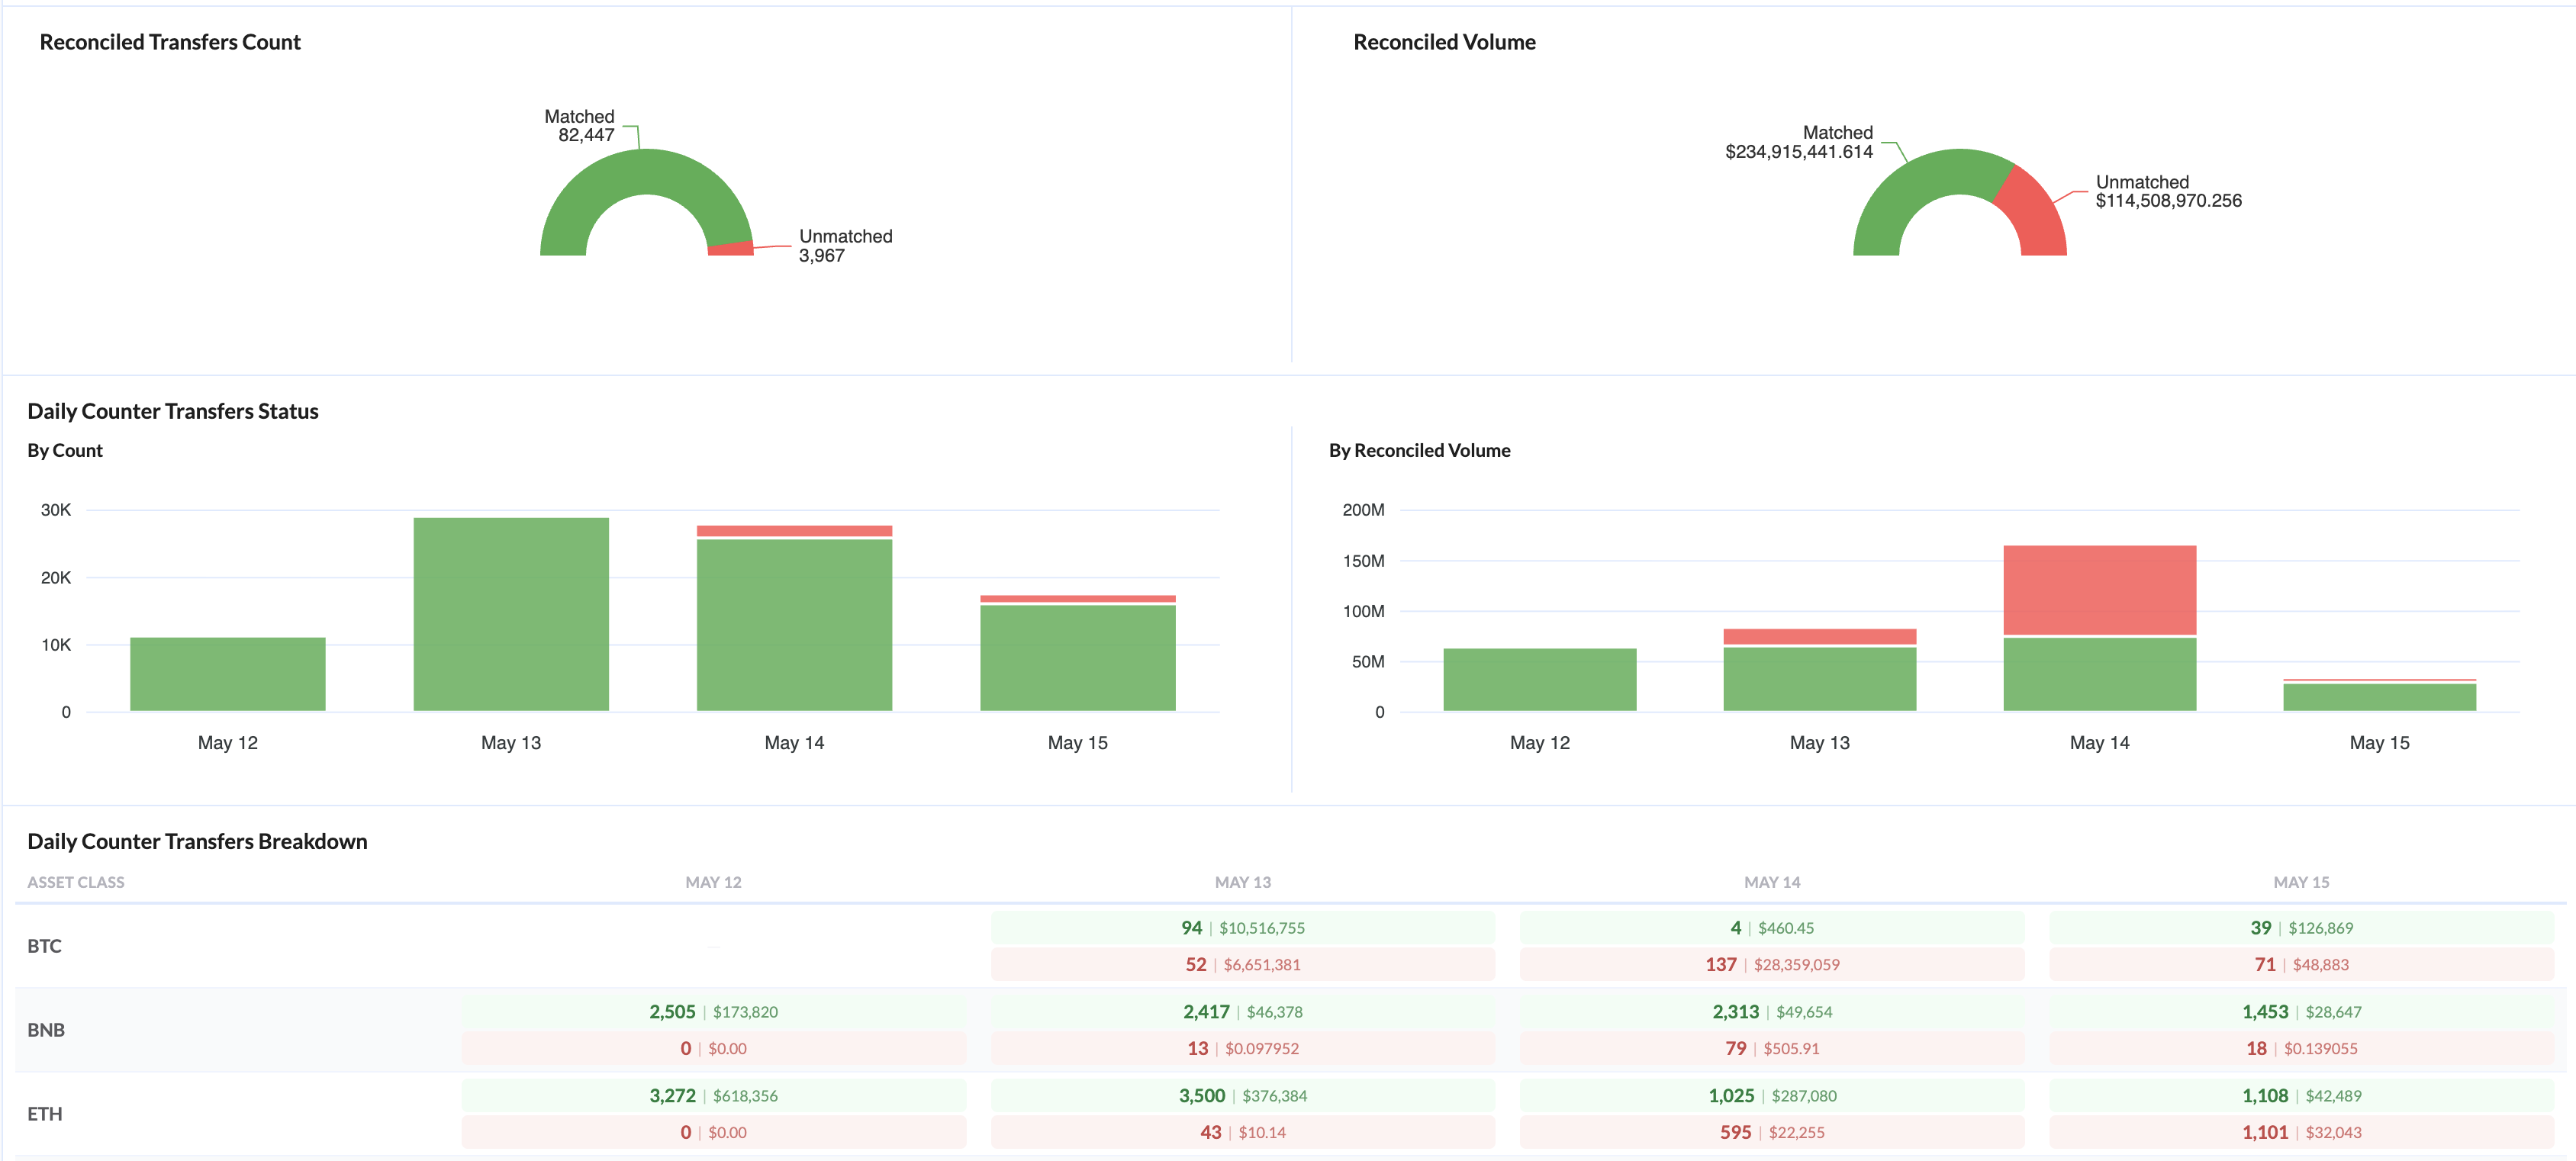
Counter Transfers Reconciliation card showing all three visualization layers.
What You'll See
Reconciliation Summary
At the top of the card, two donut charts give you an instant health check:
Reconciled Transfers Count — the number of matched vs. unmatched sub-transactions.
Reconciled Volume — the total fiat value of matched vs. unmatched activity.
Green represents matched (reconciled) transfers. Red represents unmatched (unreconciled) transfers that need attention.
Daily Status Charts
Below the donuts, two stacked bar charts show the reconciliation trend over your selected date range:
By Count — how many transfers were reconciled vs. unreconciled each day.
By Reconciled Volume — the fiat value breakdown per day.
These charts make it easy to spot anomalies. A sudden red spike on a specific day signals something went wrong — a missed import, a delayed custodian sync, or a new transfer pattern that the matching engine hasn't seen before.
Daily status charts for an on-chain subsystem showing transfer count and volume trends.
Asset Class Breakdown Table
The bottom section is a detailed breakdown table with asset classes as rows and dates as columns.
Each cell shows two color-coded values:
Green pill — reconciled count | fiat volume
Red pill — unreconciled count | fiat volume
Every value is a clickable link that opens the Ledger pre-filtered to exactly that date, asset class, and reconciliation status. One click takes you from a high-level number straight to the underlying transactions.
Filtering
All views respond to the same filters at the top of the card:
Filter | What it does |
|---|---|
Date range | Select any custom range (defaults to the last 30 days) |
Asset Class | Narrow down to a specific asset class (e.g., BTC, ETH, SOL) |
Networks | Filter by blockchain network or platform |
When a filter is applied, the donuts, charts, and table all update together.
Reconciliation view filtered to Ethereum (ETH), showing only ETH activity across all three sections.
How Matching Works
Collection — Transfers are collected from your connected platforms and wallets.
Matching — The reconciliation engine automatically groups sub-transactions that represent two sides of the same transfer into a match group.
Visualization — The Overview card aggregates the results: sub-transactions with a match group are "reconciled"; those without are "unreconciled."
Match types include:
Simple
A straightforward 1:1 pairing between two sub-transactions.
Complex
Many-to-many groupings for split or batched transfers.
Manual
User-confirmed matches for edge cases.
Typical Workflow
Open the Reconciliation tab on the Overview page.
Check the donuts for your overall reconciliation rate.
Scan the daily charts for anomalies — red spikes indicate days with problems.
Use the breakdown table to pinpoint which asset class and date are affected.
Click the red pill to jump directly into the Ledger and inspect the unmatched transactions.
Investigate and resolve — the matching engine picks up newly resolved transfers on its next run.

Key Metrics
Metric | Description |
|---|---|
Matched Transfers Count | Sub-transactions successfully paired with a counterpart |
Unmatched Transfers Count | Sub-transactions with no counterpart found yet |
Total Fiat Value Matched | Aggregate fiat value of all reconciled sub-transactions |
Total Fiat Value Unmatched | Aggregate fiat value of all unreconciled sub-transactions |
FAQ
Q: Why do the donut totals differ from the charts/table totals?
The daily charts and breakdown table only include verified asset classes to ensure data quality. The donuts include all asset classes. If you have unverified asset classes with activity, the donuts will show higher totals.
Q: How often is the data refreshed?
The data reflects the most recent reconciliation pipeline run. The pipeline runs on a recurring schedule — check with your administrator for the exact frequency.
Q: What does clicking a pill in the table do?
It opens the Ledger page with filters pre-set for that specific date, asset class, and reconciliation status (matched or unmatched). No manual filter setup needed.
Q: Can I export the reconciliation data?
The Ledger page (reached via the table links) supports standard transaction export capabilities.